


Blog
Wellbeing Radar Chart
in D3.js: Web Dev
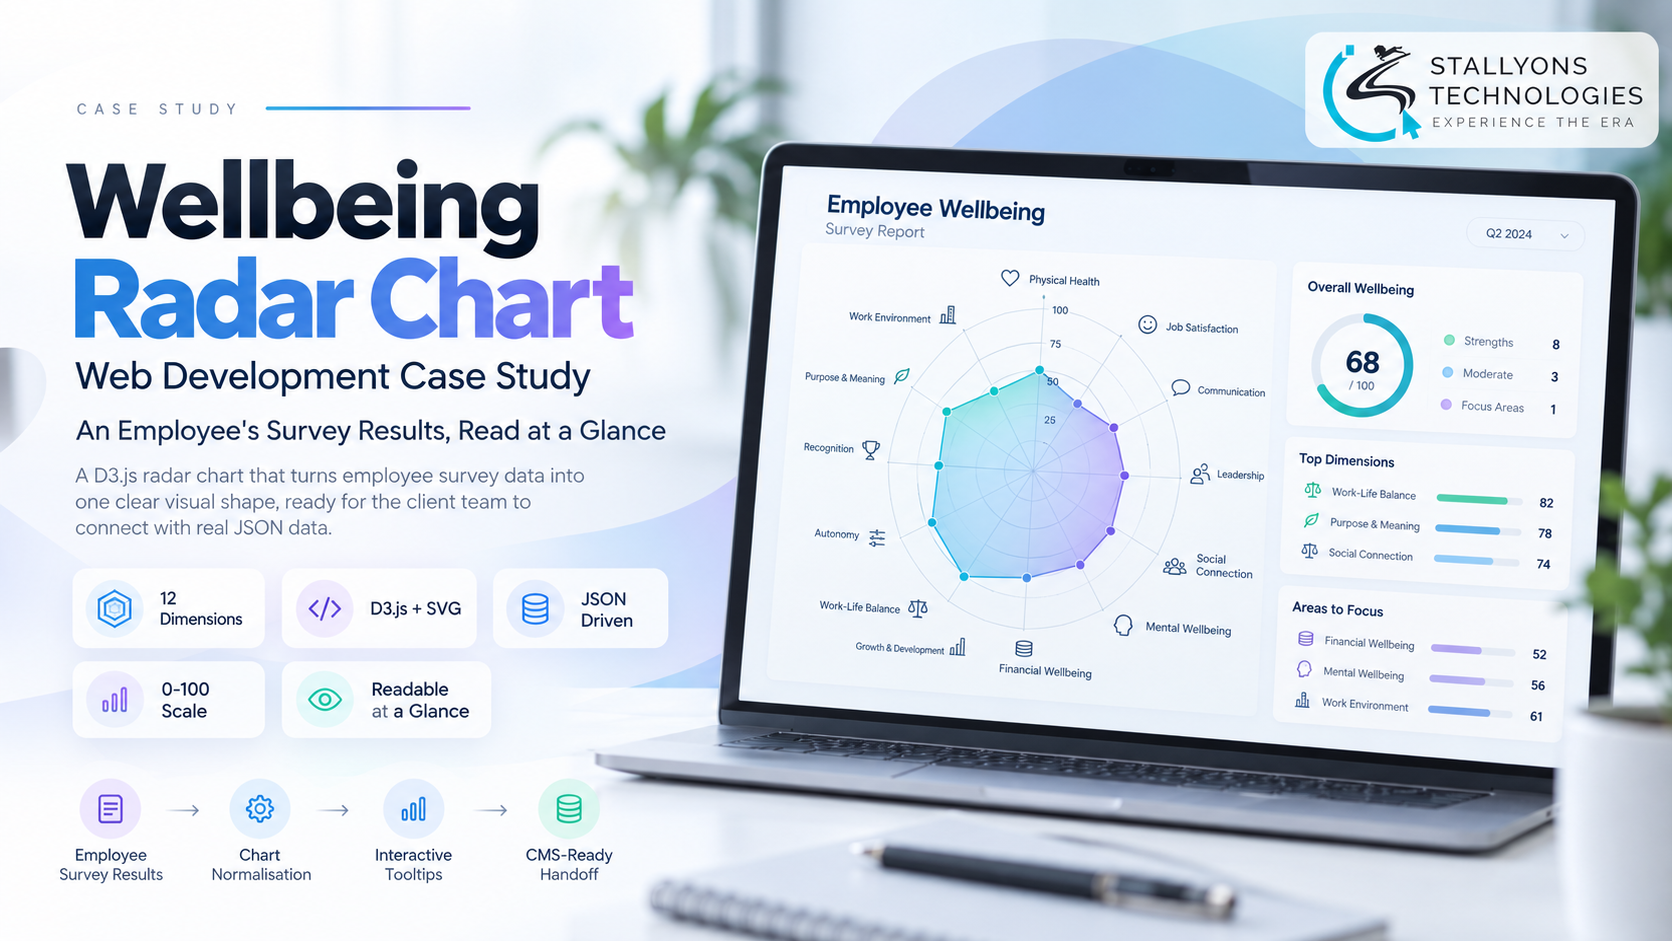
An employee finishes a long wellbeing survey and opens their personal report. At the top sits one chart, and it has a hard job: sum up dozens of answers in a shape they can read in seconds, before they scroll a single line. If that chart is confusing, the rest of the report rarely gets read.
A client who runs an employee wellbeing survey for a large organisation in Europe had a wireframe for that chart and wanted a first working version. Wellbeing Radar Chart is the D3.js radar, or spider, chart we built for it: twelve dimensions drawn on one readable shape, fed from a simple data file, and handed over so the client’s own team could later connect it to real survey results.
Put simply, a person’s survey answers become one radar shape, so they understand their whole wellbeing profile at a glance instead of reading a table of numbers.
The Starting Point: Twelve Dimensions, Two Different Scales
A radar chart looks simple until the data fights it. Here the twelve axes did not share a scale, and the chart had to stay honest while remaining readable to someone who had never seen one before. That shaped every requirement.
- Two scales on one chart. Seven qualitative wellbeing scores run 1 to 5, while five work-time measures run 1 to 100, and those do not share an axis naturally.
- Readable at a glance. As the report’s headline chart, it had to be understood without a legend lesson or a key to decode.
- An explanation per axis. Employees needed a short description of what each dimension, such as sleep quality or focus time, actually means.
- Built to hand over. The client’s own content team had to be able to plug in real data later without touching the drawing code.
- True to the wireframe. Colours, labels, and layout had to follow the client’s existing concept closely.
The Build: A Data File In, One Honest Shape Out
The approach kept the chart dumb and the data smart, so the client’s team controls the content and the code just draws it. Getting a custom visualisation to read cleanly while staying faithful to a wireframe is careful front-end web development, not a drag-and-drop chart widget, because an off-the-shelf library will not respect a bespoke layout or a mixed-scale data set. The build ran in a clear sequence:
- We agreed the wireframe, a reference chart, and the shape of the data, and the client supplied a random-data JSON file to build against.
- A working radar chart was shared within three days, drawn in D3.js as SVG, for the client to react to early.
- We raised the two-scale problem and proposed mapping the 1 to 5 scores onto the same 0 to 100 scale as the work-time measures, by multiplying by twenty.
- The client agreed, so every axis now shares one radial scale and no half of the chart gets flattened.
- Colours and styling were refined from the client’s consolidated feedback in a single focused round.
- The final page and a source code ZIP were handed over for the client’s team to connect to real survey data.
The chart reads everything it needs from the JSON file: each axis label, its value, and the tooltip text that explains the dimension. The twelve axes cover seven qualitative wellbeing scores, such as physical activity, sleep quality, and social interaction, alongside five work-time measures, such as focus, learning, and rest time, and grid rings, labelled axes, and a single filled shape show where a person sits across all of them. Because the drawing logic and the content are kept apart like this, the piece behaves like a small, well-scoped bespoke software component rather than a throwaway script, which is exactly what makes a clean hand-over possible.
Technical Architecture
This is a single HTML page with no server behind it, which is part of why it hands over so cleanly. The intelligence sits in two places: the normalisation step and the data-driven axes. Each layer does one thing.
- Visualisation. D3.js gives full control of a custom chart, rather than the fixed options of a charting library.
- Rendering. SVG keeps the chart sharp at any size and easy to style to the wireframe.
- Data. A JSON file holds labels, values, and tooltip texts, in the same shape the real survey data can use.
- Scale. A single radial scale from 0 to 100, with the 1 to 5 scores mapped up in one place before drawing, so every axis carries equal weight.
- Interaction. Each axis carries its description text from the JSON, ready for hover tooltips that explain the dimension in plain words.
- Delivery. A single HTML page plus a source code ZIP, built so the client’s content team can take it from here.
The one genuinely hard decision was the scale. Plotting 1 to 5 scores next to 1 to 100 values on the same radar would have flattened half the shape into the centre and made the chart lie about the person’s profile. Normalising both to 0 to 100 in a single place, before anything is drawn, gives every axis a fair say while keeping one scale the reader can trust.
Challenges Solved
The headline challenge was mixing two scales without distorting the picture. Plotting 1 to 5 scores next to 1 to 100 values on the same radar would have flattened the smaller-scale axes into the centre, making seven of the twelve dimensions look like near-zero regardless of the real answers. Rather than splitting the data into two charts, which would have broken the single-glance goal, we mapped the smaller scale onto the larger one so the whole profile lives on one shape with every axis carrying equal weight. The result stays honest and readable, which is exactly what a report’s lead chart has to be.
The second challenge was keeping a first-shot chart easy to refine and easy to hand over. We shared a working version within three days, drawn straight from the client’s random-data file, so the first feedback was on something real rather than a mockup. The client’s team then gathered their comments into one consolidated list, so colour and styling changes landed in a single focused round instead of a drip of small tweaks. And because every label, value, and description lives in the JSON rather than in the code, the client’s team can connect real survey data and change wording later without us in the loop.
The Result
The first working draft was ready within three days, and after one feedback round on scale and styling, the client accepted the work, released both milestones, and left a review. What they now hold is a radar chart that shows all twelve wellbeing dimensions on one honest, readable shape, with per-axis explanations and a data format their own team can wire straight into live survey results.
It works because the chart was built around the real problem, two scales and a hand-over, not around a generic chart template. If you need a custom data visualisation that your team can own, you can hire JavaScript developers who have built data-driven D3 charts, or tell us what your data needs to say at a glance and our US-registered web development company will shape the chart and the data format together. It suits any health and wellbeing organisation turning survey results into reports people actually read.
Frequently Asked Questions
What is the Wellbeing Radar Chart?
It is a custom radar, or spider, chart built in D3.js for an employee wellbeing survey. It shows twelve dimensions on one shape, reads its labels and values from a data file, and was handed over so the client’s own team could connect it to real survey results.
How does it handle two different scales on one chart?
Seven wellbeing scores run 1 to 5 and five work-time measures run 1 to 100. We map the 1 to 5 scores up to the same 0 to 100 scale by multiplying by twenty, in one place before drawing, so every axis shares one radial scale and none of the shape gets flattened.
Why D3.js rather than a ready-made chart library?
The chart had to follow a specific wireframe, carry per-axis descriptions, and handle a mixed-scale data set. D3.js with SVG gives full control over the layout and styling, which a fixed charting widget cannot, while staying sharp at any size.
Can the client’s team connect it to real data?
Yes. Every label, value, and tooltip text lives in a JSON file in the same shape the real survey data uses. The client’s content team can swap the random data for live results and change wording without touching the drawing code.
How was the chart delivered?
As a single HTML page that draws the chart with D3.js, plus a source code ZIP. A first draft was shared within three days for feedback, and the final files were handed over after one consolidated round of styling changes.