


Blog
Squarespace Security Dashboard
Redesign
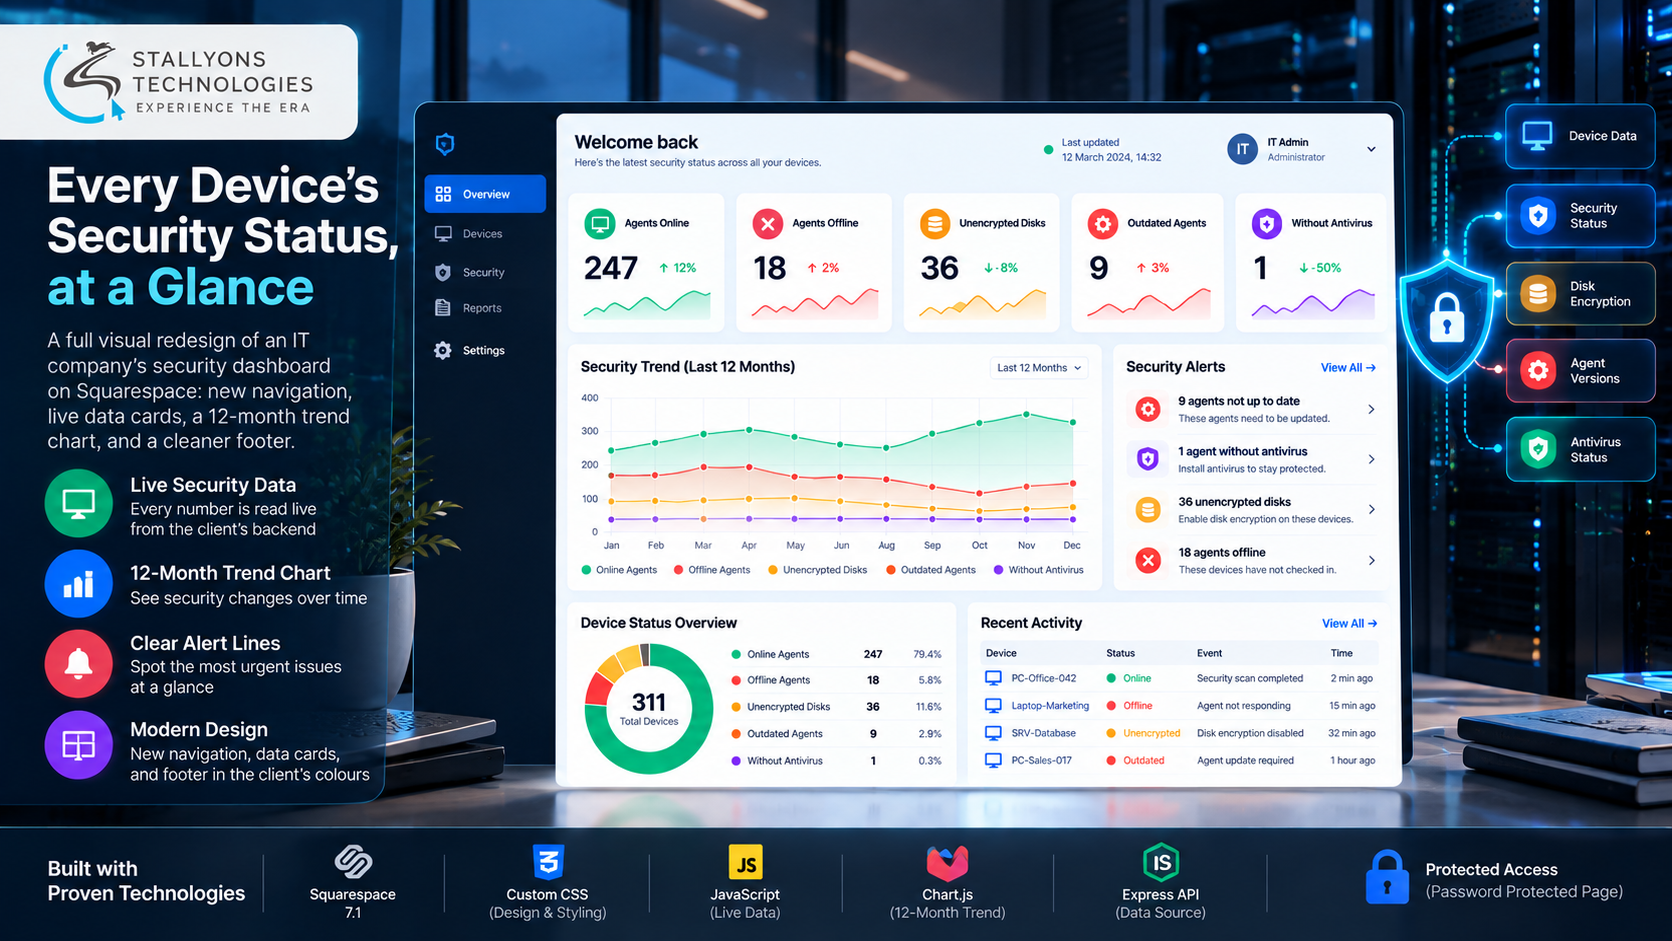
A French IT services company watches over its customers’ computers through small software agents. Its dashboard shows how many agents are online or offline, how many disks are unencrypted, how many agents are out of date, and how many machines have no antivirus. The backend already worked, but the page looked unfinished and was hard to read, so a real problem could sit on the screen and still be missed.
The client handed us a target design and asked for a full visual overhaul on Squarespace, with every number and function kept intact. We rebuilt the page with a modern navigation bar, clean white data cards, a 12-month trend chart, clear alert lines, and a better footer, all in the client’s own colours and font. Every figure on the page is a variable read live from the client’s existing backend. The work was delivered in June 2024 across two milestones, refined after one round of feedback, and closed with a positive review.
Put simply, when the backend has new numbers, every card and the chart update on their own, with no design work. The dashboard sits behind a login, reads only summary counts, and never changes anything in the client’s systems. Matching a precise target picture on Squarespace while keeping every number live is the substance of this custom Squarespace development.
The Starting Point: A Working Dashboard That Was Hard to Read
For an IT security provider, the dashboard is what customers and staff look at every day, so the redesign had to raise the quality of the page without touching what the backend already did. That set a short list of requirements.
- Replace an unfinished look. The page worked but did not match the company’s brand or the quality of its service.
- Make the numbers easy to scan. Key figures, such as offline agents or machines without antivirus, did not stand out on the old page.
- Fix a weak navigation and footer. The navigation bar was dated and the footer added little.
- Build around live numbers, not static text. Every figure comes from the backend and changes over time, so the design had to use variables rather than typed-in values.
- Break nothing. Existing content and functions had to keep working after the redesign.
The Build: Match the Target, Keep Every Number Live
The new dashboard follows the client’s target picture closely. A modern navigation bar sits at the top in the brand colours, each area of the data gets its own clean white card, and a trend chart shows the last twelve months. The build ran in a clear order:
- We compared the current page with the client’s target picture and received the brand font, colours, and background artwork.
- We built the navigation bar, the data cards, the chart panel, and the footer to the target, on both desktop and mobile.
- Each figure, such as online count, offline count, unencrypted disks, outdated agents, and machines without antivirus, became a variable read from the client’s backend.
- Alert lines, such as nine agents not up to date or one agent without antivirus, were placed on separate lines so the most urgent issues read at a glance.
- After the first review, the chart was centred on mobile, the text was scaled down, and the alert lines were split onto two lines.
- We handed over the code and removed the temporary preview at the client’s request.
The design uses the client’s own font, Outfit, their colour scheme, and their background artwork, without the logo or company name. On a phone, the cards simply stack one below the other. Because every number is loaded from the backend, the dashboard changes the moment the data does, with no one editing the page.
Technical Architecture
The client’s backend and database were already in place, so the project added a front end on Squarespace rather than a new system. Nothing here invents a backend; the existing API stays the single source of the numbers. Each layer does one job.
- Platform. Squarespace 7.1 holds the page, the navigation, and the footer the client can edit.
- Design layer. A site-wide custom CSS layer carries the brand colours, the Outfit font, and the card components.
- Live data. Small JavaScript widgets in code blocks read each number from the client’s API. Wiring a live front end to an existing API this way is standard web development on top of the Squarespace page.
- Chart. Chart.js draws the 12-month trend, centred and scaled for mobile.
- Data source. The client’s existing Express API serves read-only summary counts.
- Access. A password-protected page keeps the security data private, and an unpublished preview page carried feedback without touching the live page.
The part worth engineering carefully was not the layout. It was matching the target design closely, keeping every number live, and making sure sensitive security data stayed behind a login the whole way through.
Challenges Solved
The first challenge was matching a design made of shapes and layouts that do not exist as ready-made Squarespace blocks. These were agreed with the client early: close matches built from styled sections and custom CSS, with small changes where needed. The second was turning a picture into live data, since the target was a static image but every number had to come from the backend; each figure was mapped to a field in the client’s data and loaded by a small script, so the client can extend the data and the page follows. The third surfaced after the first review, when the chart was not centred on phones and some text was too large; the chart was centred and resized, the mobile text was scaled down, and the alert lines were split onto two lines.
The last challenge was privacy. A dashboard about unprotected machines must never be public, so the page sits behind a password, the scripts read only summary counts, and the temporary preview link was removed once the client had the final work. That security-first, data-heavy discipline is what fintech and other compliance-minded teams expect from any dashboard that handles sensitive numbers.
The Result
The outcome is a dashboard that matches the target picture, carries every number as a live variable, and shows a full year of trend at a glance. The static design was approved first, the live data followed, and one round of feedback was implemented before release. The client released both milestones and left a positive review. When the backend has new figures, the cards and the chart show them straight away, with no design change, and the sensitive data stays behind a login.
The build works because it was built around variables and a component pattern, so new data fields become new cards using the same styling. If you are planning a dashboard like this, you can hire JavaScript developers who have bound a Squarespace front end to a live API with Chart.js, or tell us what your backend already returns and we will map it to a branded dashboard that updates itself.
Frequently Asked Questions
Can a Squarespace page show live data from an existing backend?
Yes. Small JavaScript widgets in Squarespace code blocks read each number from the client’s existing API, and Chart.js draws the trend chart. Every figure is a variable, so when the backend changes, the cards and the chart update on their own with no edit to the page.
Was the client’s backend rebuilt for this project?
No. The client’s Express backend and database were already in place and kept working untouched. The project added a new front end on Squarespace that reads read-only summary counts from the existing API, so no number or function was lost in the redesign.
How is the security data kept private?
The dashboard sits on a password-protected page, the scripts read only summary counts rather than device details, and the page cannot change anything in the client’s systems. The temporary preview link used for feedback was removed once the final work was handed over.
Does the dashboard work on mobile?
Yes. On a phone, the cards stack one below the other, the trend chart is centred and scaled down, the text is sized for small screens, and the alert lines sit on two lines. These mobile refinements were made after the first round of client feedback.
Can the design be extended later?
Yes. The cards, alert lines, chart panel, navigation bar, and footer are reusable components styled in one CSS layer. The client can add a new field to the data and show it with the same card pattern, which is part of our wider Squarespace web development services.